You know the »list of figures« in academic works. But do you know the »list of texts«? 1 This seems silly, since in almost any (academic) work you have a one text which tells the main content. It may be occasionally supported by images, diagrams or tables if such information can’t be communicated well via text.
I wondered about this. It is hard to say why graphics, or, more general, non-text, seem to be 2nd class citizens in the communication of knowledge.
In the recent weeks I did collected some ideas and information on the topic, and I’ll write them down here. There are several perspectives which I found interesting – they became the headlines.
When I talk about images/graphics here, I do focus on diagrams, visualizations, photos etc. which are used for teaching/informing etc.2 It is not about images which are used to spice up some content because »Images are emotional/nice/human/whatever« (aka use of »stock photos«)
Linearity, parallelity
A distinctive property of images and text is the linearity and parallelity: Text is linear, it could be written on one long line, of which you can only read a part and on which you progress letter by letter, word by word from begin to end. Images can be understood in parallel. You can start anywhere on the image and end anywhere 6
 Image:Text is linear and have a specific order; Graphics can be processed in any order one likes (some paths may make more sense than others, though)
However, this does not mean that Language is always linear: Sign language is a visual language and has parallel elements: »The car drives slowly upwards« is signed in two parts, like this:
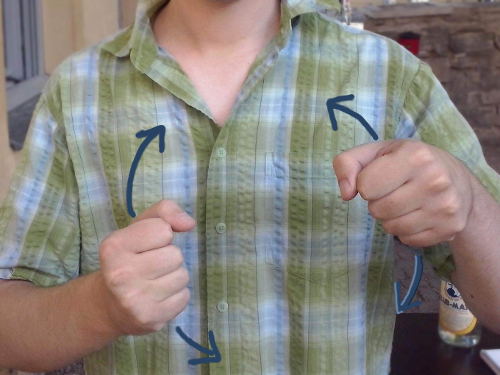 Image: German sign for »car« (corresponding to the word car, nothing new here
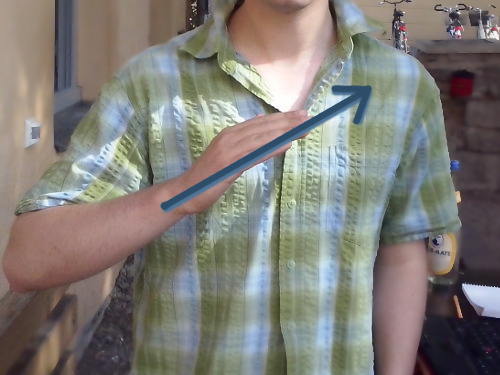 Image: German sign for »slowly«,»moving(driving)« »up(the hill or whatever)« (all in parallel
It is less the language, which is linear in itself, but the most common ways of using language: orally or as text.
Iconophobia
Abrahamic religions, which have and had a strong influence on Western Philosophy, reject images. The argument is, as far as I am concerned, that people would prayed to images and statues instead to the god of these monotheistic religions.
The philosophical criticism of images reaches far back too: Plato says that images (= what is perceived by the senses) are delusions: What is true are not the images but the ideas which can not be perceive. What we perceive are only imperfect and degraded renderings the ideas. Ideas are »true« in contrast to the perceived delusions 3 4.
Interestingly, Plato rejected as well the recording of information in general. Knowledge and the knowing person should not be divided:
»Their trust in writing, produced by external characters which are no part of themselves, will discourage the use of their own memory within them.« 5
But this view seems to have been rejected earlier than his critique of images.
What we miss
The use of images and diagrams can greatly help in teaching and understanding. However, these opportunities are in my opinion often unused.
What are the advantages that graphics and diagrams have in teaching and understanding? Larkin and Simon 6 list these:
- »Diagrams can group together all information that is used together, thus avoiding large amounts of search for the elements needed to make a problem-solving inference.«
- »Diagrams typically use location to group information about a single single element, avoiding the need to match symbolic symbolic labels.«
- »Diagrams automatically support a large number of perceptual inferences, which are extremely easy for humans«
This does not mean that images and diagrams are inherently superior. Rather they have different strengths.
 Image: the two versions of the game. Their abstract concept is the same but the representation is different
Whereas the grid representation encourages selecting fields on »lines« in the grid (useful bias); the number version triggers the (not useful bias) of selecting bigger numbers first, to reach 15 quicker. For this problem, the biases created by the graphical representation where helpful, but there are other problems in which the graphical representation may prevent a good solution.
Instead of proposing that »Graphics are intuitive« or that »Language directly represents thinking« it probably makes sense to use text and graphics intertwined: Graphics could be annotated and linked or enriched with brief texts; text might contain graphics, words linked to representations and highlighted. Thus the format that helps us the best to understand the topic at hand (speaking with Zhang: creates the right biases)
In the non-digital world, comics are a well known format to intertwine graphics and text. This is also the form chosen by Nick Sousanis to write his PhD-thesis on the interplay of Images and Text, »Unflattening«
The digital opportunities are even greater, since we can interactivity thus adding a third dimension to the two dimensional graphics.
To explain statistical concepts, visualizations can be used – like in the onlinestatbook’s visualizations. However, here the text and visualization are not much intertwined, missing the possibility to use the representations strengths at the same time while learning. Bret Victor’s »responsive documents« do exactly this: Graphics and Text are used in parallel, like in this explanations about abstractions or algorithmic thinking for learnable programming.
What is annoying
Why are there not more documents which combine text and images? The reason may be rather non-philosophical: Most (software) tools create either text or images and if they do, they use proprietary file formats. So if I publish information in the Web’s standard language HTML, I need to create the images in another program and link them. If I want to add text to an image, I either need to use a proprietary program and update the image size and the positions of the annotations manually or I use some web framework and run a server. In brief: There is no simple method of creation and distribution, neither in print or digitally.
Remarks:
- Seemingly well researched (at least in Germany) and highly interesting is the use of images in law. Researchers in this field of whom I am aware are Klaus F. Röhl and Fabian Steinhauer. Mr. Rörl has his lecture notes on »Visuelle Rechtskommunikation« online – only in German though.
- There are some postmodern texts on the meaning of images and text as media, most notably by Vilém Flusser. However, most of the writings I in this field were written in the typically postmodern style (also known as »obscure«) and thus I can offer very few outcomes of exploring this field. Feel free to give it a try though; it was interesting what I read in summaries written by people who seem to understand these texts.
- The use of graphics for visualizing numbers is well established; If you are interested, you could read »Grammar of Graphics«, »The Visual Display of Quantitative Information« and the »International picture language«
More Readings (Added 14.08.2015)
- Ferguson, Eugene S. »The mind's eye: Nonverbal thought in technology«. Science 197.4306 (1977): 827-836. Discusses the use and need of images and diagrams in engineering and science and in teaching them.
- Schön, Donald A. The reflective practitioner: How professionals think in action. Vol. 5126. Basic books, 1983. Has several examples of idea generation based on iterative, nonverbal and/or metaphor-based thinking.
- I collected many readings on the (non-) use of visual material for qualitative research. As an example I can give Rose, Gillian. Visual methodologies: An introduction to researching with visual materials. Sage, 2012.
More Readings (Added 21.06.2020)
- Armstrong, David F., William C. Stokoe, and Sherman Wilcox. 1995. Gesture and the Nature of Language. Cambridge ; New York, NY, USA: Cambridge University Press. Discusses how early sign language might have shaped grammar and affected spoken language. (In general, grammar in sign languages is fascinating, as there are many concepts that are unique to it e.g. classifiers)
- Agre, Philip. 2003. “Writing and Representation.” Narrative Intelligence 46: 281. Criticizes the idea of meaningful-without-context symbols (like words) and the idea that these can represent the world.
- Harris, Roy. 2009. Rationality and the Literate Mind. Routledge Advances in Communication and Linguistic Theory 7. New York: Routledge. How rationality and alphabetic writing have been seen to be connected.
- Jordan, Brigitte. 1989. “Cosmopolitical Obstetrics: Some Insights from the Training of Traditional Midwives.” Social Science & Medicine 28 (9): 925–37. Discusses that images need “literacy” as well to be interpreted and how this is connected to different kinds of knowing and ideas about education. That a correct “reading” of media needs to be learned can be obvious when watching a movie that unintentionally defies the rules of the genre, e.g. the bizarre “Samurai Cop”.
-
This observation was made by Nick Sousanis and is mentioned about in his comic/PhD thesis »Unflattening« ↩
-
An interesting perspective which may become a future blogpost is the the »grammar« of explanatory images or graphics. For visualizations of quantitative data, this is discussed in »The Grammar of Graphics« (Wilkinson). However, it would be interesting to take diagrams from physics, about assembling furniture, sketchnotes etc. and look at their rules or grammar of showing movement, time, relations and annotations. ↩
-
See his Allegory of the Cave ↩
-
In this regard, Karl Poppers Analysis of Plato’s essentialism in »The Free Society and its Enemies« or in »Essentialism« on Wikipedia ↩
-
Plato, Phaedrus, section 275a ↩
-
Larkin, Jill H., and Herbert A. Simon. »Why a diagram is (sometimes) worth ten thousand words.« Cognitive science 11.1 (1987): 65-100. ↩↩
-
Zhang, Jiajie. »The nature of external representations in problem solving.« Cognitive science 21.2 (1997): 179-217. ↩